

Modern networks generate more telemetry than at any point in operator history. RAN counters, core KPIs, transport alarms, cloud metrics, application traces, and customer experience signals all stream into separate systems, each optimized for its own domain. Yet when a service degrades, engineers still scramble between dashboards, logs, and vendor tools, stitching together clues manually. The culprit isn't a lack of data; it is an abundance of isolated data. Operators have invested heavily in observability, but not in the correlation layer that makes observability actionable. That missing correlation layer is cross-domain correlation — the capability that transforms fragmented telemetry into end to end service visibility.
Over the last decade, operators modernized individual domains. RAN systems evolved with richer counters, SON systems, and cell-level anomaly detection. Core networks introduced UPF load metrics, session KPIs, and slice-aware telemetry. Transport networks adopted segment routing, optical telemetry, and latency or jitter analytics. Cloud environments began tracking pod health, autoscaling events, node pressure, and container logs. Applications added API traces, error codes, and user-experience metrics. Each domain matured, but in isolation. When a customer reports degraded throughput, the root cause could be a congested RAN sector, a misbalanced UPF, a flapping transport link, a cloud node under CPU pressure, a slow application backend, or a combination of all five. This siloed visibility creates recurring operational challenges: slow mean time to resolution due to sequential escalations, false positives when one domain flags symptoms originating elsewhere, overprovisioning because capacity planning is domain-local, high dependency on senior engineers who “know where to look,” and inconsistent customer experience because issues surface only after impact. Operators already possess the raw data needed for correlation — they simply lack the frameworks to unify it.
Traditional NOC structures mirror technical silos. RAN teams monitor signal-to-interference ratios, transport teams watch fiber attenuation, infrastructure teams track CPU utilization, and application teams monitor HTTP error rates. During an outage, this creates a familiar chain reaction. A single fault triggers thousands of alarms across dashboards, creating an alarm flood. Each team proves their layer is “green,” leading to cross-domain contention. Senior engineers manually stitch logs, traces, and metrics to reconstruct the failure path. Domain-specific tools excel at describing what is happening inside their operational scope, but they are blind to how it affects the broader ecosystem.
Cross-domain correlation is not “putting all logs in one place.” It is the automated ingestion, parsing, and linking of metrics, logs, traces, and alerts across RAN, Core, Transport, Cloud, and Application layers to reveal root cause dependency chains. A mature correlation system must normalize telemetry across vendors and domains, map dependencies from cell to UPF to transport path to cloud service to API, detect anomalies in each domain, link anomalies into a cross-domain incident topology, identify root causes and suppress downstream alarms, and trigger domain-specific remediation or autonomous operations workflows. Correlation engines rely on three forms of mapping. Temporal correlation aligns events across systems using precise timestamps to reconstruct the failure sequence. Topological correlation understands live end-to-end architecture — how virtual machines map to physical servers, how servers connect to switches, and how switches route traffic. Logical-to-physical mapping links abstract software layers or SLAs directly to the hardware footprints supporting them.
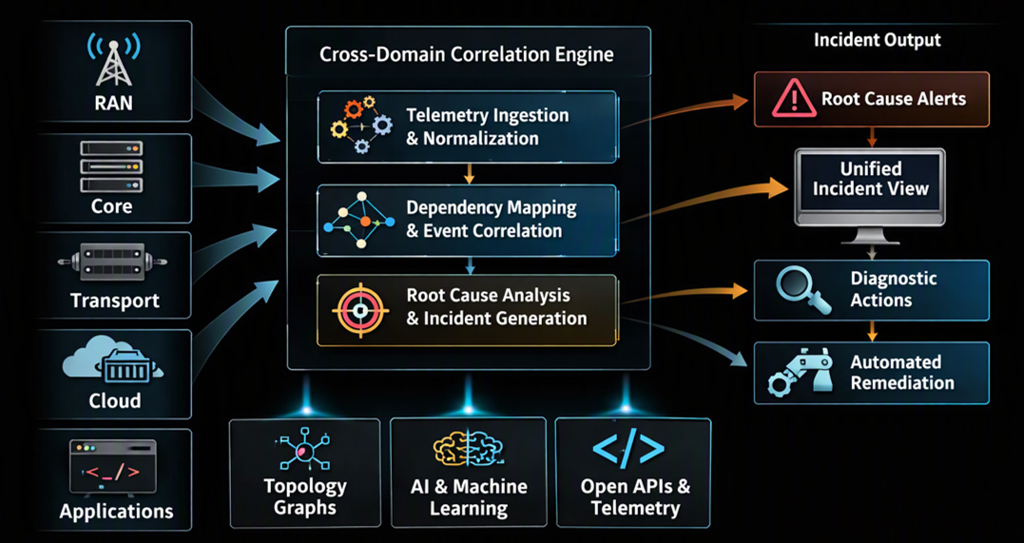
Consider a sudden drop in throughput for premium 5G enterprise customers. Without cross-domain correlation, the RAN team checks towers and finds them active, the IP core team checks routers and finds them stable, and the cloud team notes a brief CPU spike on the UPF cluster but not critical. Hours of packet captures and log analysis eventually reveal the true cause: a subtle packet-drop issue on a data-center switch port, forcing UPF retransmissions and degrading 5G slice performance. With cross-domain correlation, the moment throughput drops, the correlation engine maps the degraded slice to the virtualized UPF, identifies the physical server hosting it, and traces its network path to the exact switch port. Within seconds, thousands of secondary events are suppressed and replaced with a single actionable incident: “Anomalous packet drop rate on Switch Port X is degrading the UPF instance, causing a 22% drop in 5G slice throughput.” Troubleshooting shifts from manual root cause reconstruction to precise intervention.
Cross-domain correlation is difficult because vendors expose nonuniform telemetry formats, domains use different time granularities — milliseconds in transport, seconds in cloud, minutes in RAN — topology changes dynamically through UPF relocation, autoscaling, or SRTE path shifts, legacy systems lack APIs, and organizational silos mirror technical silos. The challenge is both architectural and cultural. The next evolution is autonomous operations systems that use correlation graphs to automate troubleshooting. These systems validate anomalies, run targeted diagnostics, query logs across domains, suggest or execute remediation, and update incident graphs in real time. Instead of engineers manually correlating events, these systems present a single correlated incident view: “Root cause: UPF overload triggered transport rerouting, causing RAN throughput degradation.” This is the future of operator operations — not more dashboards, but more intelligence.
Implementing true cross-domain correlation requires moving beyond legacy, rules-based event management. Modern architectures rely on several technological pillars. Dynamic topology graphs maintain a real-time map of physical and logical dependencies, updating instantly as virtual machines migrate or network paths change. Standardized telemetry and open APIs such as Open-Telemetry, gNMI/gNOI, and TM Forum Open APIs allow uniform ingestion across legacy routers and cloud-native microservices. AIOps and machine learning detect multivariate anomalies and uncover hidden relationships where explicit topology is incomplete. Organizations that implement cross-domain correlation realize immediate benefits: drastic reduction in mean time to resolution as root-cause analysis drops from hours to minutes, smarter alerting that filters noise and leaves actionable incidents, proactive operations where early indicators trigger preemptive remediation, and optimized resource allocation where junior operators can handle complex escalations with contextual intelligence. Correlation becomes an operational accelerator for resilience.
As networks evolve toward autonomous, self-healing architectures, fragmented visibility becomes a liability. Operators can no longer afford fragmented monitoring silos into RAN, transport, cloud, and application layers. Cross-domain correlation provides a unified blueprint of how a telecom or enterprise ecosystem operates as a unified architecture. By breaking down operational walls between hardware, network, cloud, and code, it transforms troubleshooting from reactive troubleshooting into automated root cause analysis. For operators navigating unprecedented complexity, correlation is not a luxury — it is the foundational missing link.