

Modern telecom networks span private clouds, public clouds, partner ecosystems, and application layers. Traditional monitoring tools—fault, performance, and customer experience systems—operate in isolation, creating blind spots that slow detection, inflate MTTR, and obscure customer impact. As networks become more distributed and service chains more interdependent, operators require a unified operational view. Unified observability addresses this challenge by merging fault, performance, and experience telemetry into a single contextualized framework. By correlating signals across domains, it reduces alert noise, accelerates root cause isolation, and aligns NOC, engineering, and business teams around shared outcomes. Real deployments demonstrate the impact: one global operator reduced MTTR from 42 minutes to 1.5 minutes, a 96% improvement, after adopting unified observability.
User experience today depends on a mesh of interconnected domains—private operator networks, partner networks, cloud environments, and application ecosystems. A fault in any one of these areas can degrade customer experience, even when the operator does not own that domain. Despite this complexity, operators remain accountable for end to end service outcomes, making unified visibility essential. Yet most organizations still rely on fragmented operational tools. Fault management systems, performance management systems, customer experience platforms, and domain specific monitoring utilities all operate independently. This fragmentation produces noisy, uncorrelated alerts, slow triage, manual root cause analysis, and leadership visibility gaps. Case studies consistently show that siloed visibility contributes to revenue impacting downtime and delayed reporting. At the same time, operators increasingly treat customer experience metrics—NPS, activation time, and notification time—as core operational KPIs. Unified OSS/BSS frameworks have already reduced activation time by 55% and improved NPS by 22%, demonstrating the value of merging operational and experience data.
Fault data forms the foundation of reliability. It includes alarms, events, severity indicators, crash reports, stack traces, and system downtime, answering the fundamental question: what broke? Unified observability strengthens fault visibility by correlating alarms with performance degradation, linking faults to customer impact, prioritizing issues based on real user experience, and reducing alert fatigue through contextual insights. Platforms developed by leading North American network solution providers route high value performance alerts into AI driven engines to reduce noise and accelerate troubleshooting. Performance telemetry—latency, throughput, jitter, packet loss, resource utilization, distributed traces, and API response times—reveals how well the system is running. Unified observability adds multi domain correlation, predictive analytics, automated decisioning, and real time anomaly detection, enabling operators to pinpoint whether RAN, transport, core, cloud, or application layers are responsible for customer impacting issues. Experience data captures the human impact of network behavior, including QoE metrics, NPS, application performance, customer journey telemetry, activation timelines, Core Web Vitals, and session behavior. When merged with network telemetry, it allows operators to prioritize issues based on customer impact, trigger automated notifications, drive closed loop remediation, and provide leadership dashboards with uptime, performance, and investment insights. Real deployments show that merging operational and experience data reduces fault to notification cycles by 48%.
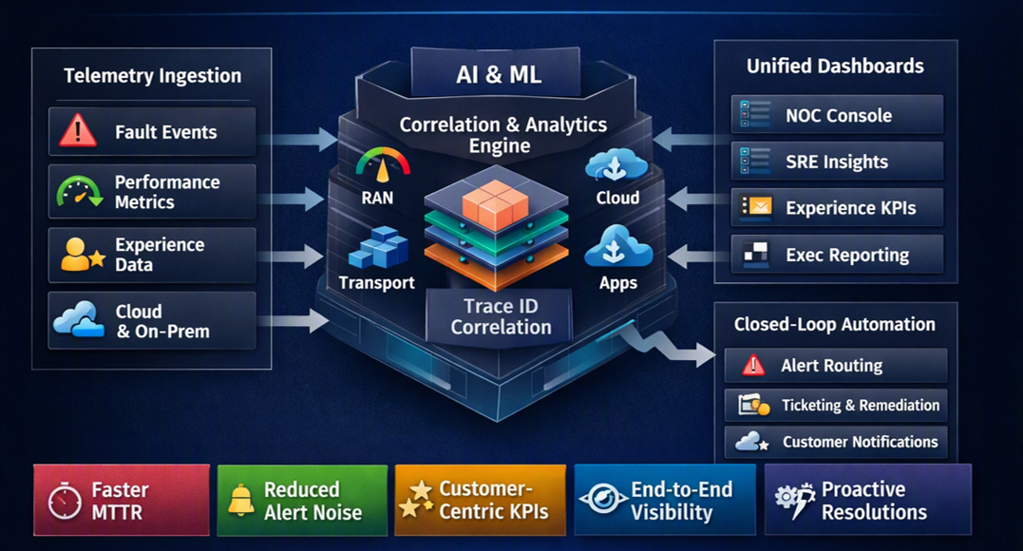
A unified ingestion layer collects real time logs, metrics, traces, multi domain telemetry, cloud and on prem signals, and immutable storage for compliance. OpenTelemetry has emerged as the industry standard for vendor agnostic ingestion, eliminating competing agents and enforcing consistent data formats. The correlation engine fuses fault, performance, and experience data using shared identifiers such as TraceID. Frontend RUM generates a TraceID, APM propagates it across microservices, and logging libraries embed it into raw logs. This creates a unified timeline that enables instantaneous cross platform debugging. Unified dashboards then provide NOC views, DevOps/SRE insights, leadership reporting, automated alert routing, and severity based escalation, with real deployments achieving median acknowledgment times as low as 20 seconds. Automation completes the loop through policy based remediation, automated ticketing, customer notification workflows, and feedback loops into OSS/BSS systems.
The operational impact is significant. Unified observability reduces MTTR, MTTA, root cause analysis time, and escalation cycles. Real world improvements include MTTR decreasing from 42 minutes to 1.5 minutes and MTTA decreasing from 14 minutes to 20 seconds. Correlated signals, high value alerts, noise suppression, and contextual insights reduce alert fatigue. Faster activation, proactive notifications, predictive issue detection, and higher NPS improve customer experience. Executive dashboards, investment insights, compliance readiness, and end to end traceability enhance leadership visibility. Consolidating telemetry pipelines lowers licensing costs, reduces data duplication, and decreases cognitive overhead for engineering teams. Unified observability also enables operators to shift from infrastructure metrics to experience centric SLOs, aligning engineering priorities with business outcomes.
To realize these benefits, operators should standardize telemetry collection by adopting OpenTelemetry across infrastructure, applications, and user interfaces. All network domains—RAN, transport, core, cloud, application, and customer experience—must share a unified context. Operational focus should shift from “what broke?” to “who is affected?” Closed loop remediation delivers the highest operational ROI. Leadership dashboards should provide unified visibility into uptime, performance, customer impact, and investment priorities.
Unified observability is now foundational to modern telecom operations. By merging fault, performance, and experience data into a single operational truth, operators gain the clarity needed to reduce downtime, accelerate response, and deliver resilient, customer centric services. The evidence across the industry is consistent: unified observability transforms operations, eliminates silos, and aligns every team—from NOC to DevOps to the C suite—around shared outcomes.